A Study on Financial Analysis of Selective Indian IT
Companies Based on Specific Ratios – Research Paper
Authored by Dr. Sachin Bhide, Founder and Strategy Designer at Eha Management Consultancy
and Manali Bedekar, Akshata Latthe and Nihal Lodha worked as Summer Interns at Eha Management Consultancy
| Sr.No | Table of Contents | Sr.No | Table of Contents | Sr.No | Table of Contents |
| 1 | Abstract | 2 | Keywords | 3 | Introduction |
| 4 | Objectives of the Study | 5 | Research Methodology | 6 | Literature review |
| 7 | Research gap | 8 | Data Analysis and Interpretation | 9 | Findings |
| 10 | Conclusion | 11 | Limitations of the Research | 12 | Websites |
First published on 22 June 2020 by Eha Management Consultancy
www.ehamanagementconsultancy.comCopyright © 2020 Eha Management Consultancy
Dr. Sachin Bhide asserts the moral right to be identified as the author of this work
All rights reserved. No part of the publication may be reproduced, stored in a retrieval system (including but not limited to computers, disks, external drives, electronic or digital devices, e-readers, websites), or transmitted in any form or by any means (including but not limited to cyclostyling, photocopying, docutech or other reprographic reproductions, mechanical, recording, electronic, digital versions) without the prior written permission of the publisher, nor be otherwise circulated in any form of binding or cover other than that in which it is published and without a similar condition being imposed on the subsequent purchaser.Abstract
Keyword
Introduction
Ratio analysis is like litmus test from financial aspect which will improve your understanding of monetary results and trends over time, and supply key indicators of organizational performance. Ratio Analysis plays crucial role for analyzing financial position, liquidity, profitability, risk, solvency, efficiency, and operations effectiveness and proper utilization of funds of the company.
Indian information technology (IT) giants like Infosys, WIPRO and Tata Consultancy Services (TCS) have made their mark globally. Information technology (IT) industry has crucial role in the contribution in the India’s GDP. India, with its huge demographic dividend potential, has emerged because the information technology (IT) hub of the planet. These days’ new employment opportunities are being created in this sector.Objectives of the Study
- To analyze financial performance of Indian information technology (IT) Companies.
- To provide basic knowledge about financial analysis.
- To use Ratio Analysis as a major tool for analyzing performance.
Research Methodology
The research design used for this study is descriptive research design. Descriptive method describes the subject of the research and it focuses more on “what” of the subject rather than “why” of the subject.
The research design used for this study is descriptive research design. Descriptive method describes the subject of the research and it focuses more on “what” of the subject rather than “why” of the subject.
Sector
The researchers have taken companies within information technology (IT) industry as information technology (IT) industry is growing rapidly and changing the shape of Indian business standards. So that the process of analysis will be helpful for determining financial strengths and weaknesses of the information technology (IT) companies
- Having at least one office in Pune
- Listed on stock exchange
- Variety in terms of scale
Selected Companies:
- Infosys
- Wipro
- Hindustan Computers Limited (HCL)
- Tata Consultancy Services (TCS)
- Persistent Systems
Literature Review
Research gap
Data Analysis and Interpretation
Formula (Net profit ÷ Net sales) x 100
| Company Name | 2016-17 | 2017-18 | 2018-19 | Average |
| Infosys | 21.00 | 22.82 | 18.63 | 20.81 |
| Tata Consultancy Services (TCS) | 22.34 | 21.02 | 21.54 | 21.63 |
| Persistent Systems | 10.47 | 10.64 | 10.44 | 10.51 |
| HCL Technologies | 18.08 | 17.22 | 16.74 | 17.34 |
| Wipro | 15.36 | 14.68 | 15.28 | 15.10 |
| Average | 17.45 | 17.27 | 16.8 | 17.08 |
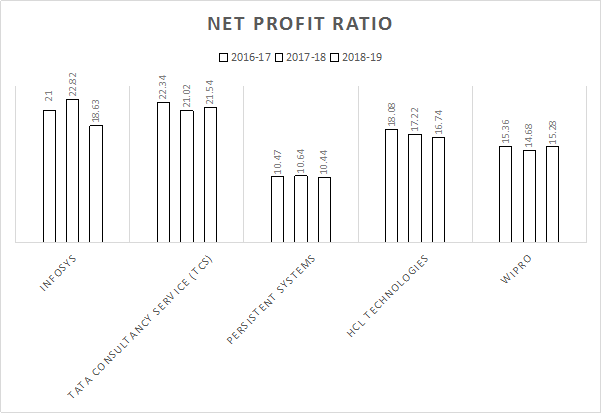
Interpretation
Return on Capital Employed ratio measures the success of the business in generating satisfactory profit on capital invested. In other words, the ratio measures how well a corporation is generating profits from its capital. ROCE is a crucial profitability ratio and is usually employed by investors to screen for suitable investment candidates.
Formula
| ROCE = | Capital Employed |
| EBIT |
Where,
-
- EBIT: Earnings before interest and tax
| Company Name | 2016-17 | 2017-18 | 2018-19 | Average |
| Infosys | 28.81 | 30.92 | 31.83 | 30.52 |
| Tata Consultancy Services (TCS) | 38.92 | 38.59 | 44.97 | 40.82 |
| Persistent Systems | 15.62 | 14.87 | 20.52 | 17.00 |
| HCL Technologies | 30.87 | 29.22 | 27.65 | 43.87 |
| Wipro | 20.76 | 19.91 | 19.97 | 20.4 |
| Average | 26.99 | 26.70 | 28.98 | 30.48 |
- Capital Employed: Total assets − Current liabilities

Interpretation
Return on equity is used to measure how efficiently management is using company’s assets to create profit. In other words, a ROE indicates a company’s ability to turn equity capital into net profit.
Formula
Return on Equity= Net Income/ Shareholder’s Equity
| Company Name | 2016-17 | 2017-18 | 2018-19 | Average |
| Infosys | 20.80 | 24.68 | 23.71 | 23.06 |
| Tata Consultancy Services (TCS) | 30.49 | 30.33 | 35.18 | 32.00 |
| Persistent Systems | 15.87 | 15.18 | 14.99 | 15.34 |
| HCL Technologies | 26.11 | 23.96 | 24.46 | 24.84 |
| Wipro | 16.43 | 16.69 | 15.95 | 16.35 |
| Average | 21.94 | 22.16 | 22.85 | 22.32 |

Interpretation
Return on Equity/Net worth (ROE) is one of the profitability ratios which measures how company is able to generate profits from the shareholders’ investment in the company. Generally, 15-20% ROE is considered good.
The above table shows that the average ROE of Tata Consultancy Services (TCS) is higher as compared to other four Indian IT Companies. It indicates that the company’s management team is able to efficiently utilize resources provided by investors in equity and accumulated profits of company in generating income.
If researchers compared average ratio of each company with industry average i.e. 22.32%, it shows that Infosys, Tata Consultancy Services (TCS), and HCL Technologies are doing extremely well. The other remaining two companies has comparatively poor performance but their ratio is also good according to range of good ratio stated above.
Earnings per share indicates how much a company makes for each share of its stock. A higher EPS indicates more value as any investor will pay more for a company with higher profits.
Formula
| ROCE = | Net Income − Preferred Dividends |
| End-of-Period Common Shares Outstanding |
| Company Name | 2016-17 | 2017-18 | 2018-19 | Average |
| Infosys | 62.80 | 71.07 | 35.44 | 56.43 |
| Tata Consultancy Services (TCS) | 133.41 | 134.19 | 83.05 | 116.88 |
| Persistent Systems | 37.68 | 40.39 | 43.99 | 40.68 |
| HCL Technologies | 60.33 | 62.23 | 73.58 | 65.38 |
| Wipro | 34.98 | 16.85 | 14.99 | 22.27 |
| Average | 65.84 | 64.94 | 50.21 | 60.33 |
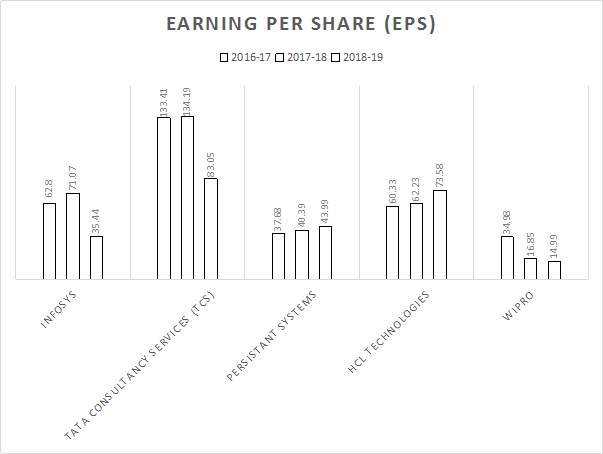
Interpretation
Earnings Per Share (EPS) is calculated to measure profit available to shareholders on per share basis. Increasing EPS indicates increasing income. It does not indicate how much profit out of that is distributed and how much is retained.
Among all selected Indian IT Companies average Earning Per Share (EPS) of Tata Consultancy Services (TCS) is higher as compared to other companies i.e. Infosys, Persistent Systems, HCL Technologies and Wipro. It indicates that the profit of this is on increasing trends. Companies are doing extremely well in their business.
In comparison with the ratio of industry average i.e. 60.33% performance of Infosys, Tata Consultancy Services (TCS), and HCL Technologies is better in comparison with other two companies.Return on Asset (ROA) is an important ratio in analyzing profitability of business in relation to the total assets of the company. In other words, this ratio measures how a company efficiently manage its assets for generating the profits of the company. This ratio is very helpful for both the management and investors of the company because it shows how well the company making profits by using its investment in assets.
Formula
Return on Asset (ROA): Net Profit/Assets * 100
| Company Name | 2016-17 | 2017-18 | 2018-19 | Average |
| Infosys | 17.21 | 20.06 | 18.17 | 18.48 |
| Tata Consultancy Services (TCS) | 25.46 | 24.29 | 27.38 | 25.71 |
| Persistent Systems | 12.84 | 12.15 | 12.31 | 12.43 |
| HCL Technologies | 18.80 | 18.16 | 17.27 | 18.07 |
| Wipro | 12.36 | 10.75 | 10.57 | 11.22 |
| Average | 17.33 | 17.08 | 17.14 | 17.18 |

Interpretation
Return on Asset (ROA) is a profitability ratio which indicates relationship between the profits of a firm and investment of a firm. It measures the profitability of investment. Higher ROA is always desirable.
From the selected Indian Information Technology (IT) companies average Return on Asset (ROA) ratio of Tata Consultancy Services (TCS) is high amongst the other four companies. It indicates that the company is efficiently managing its assets for generating its profit. Higher ROA is always better because it shows that the company is earning more money by doing less invest in assets.
In comparison with industry average i.e. 17.18, performance of Infosys, Tata Consultancy Services (TCS) and is better as compared to other two companies. It gives an idea to investors that these companies are earning good returns from their investment.
Findings
- Profit margin ratio
- Return on capital employed
- Return on Equity
- Earnings Per Share
- Return on Assets
Conclusion
| Objectives | Conclusion |
| 1. To analyze financial performance of Indian information technology (IT) Companies. | This study would be helpful in enhancing the knowledge of investors regarding the financial position and growth of information technology (IT) companies for making better investments. |
| 2. To provide basic knowledge about financial analysis. | Financial analysis is used to study whether an entity is stable, solvent, liquid, or profitable enough to warrant a monetary investment. |
| 3. To use Ratio Analysis as a major tool for analyzing performance | Managers can use ratio analysis to pinpoint strengths and weaknesses from which strategies and initiatives can be formed. Funders can use ratio analysis to measure results against other organizations or formulating plans of investing in the company |
Limitations to the research
- The ratios are based on historical numbers. Therefore, these ratios always remain same even if performance of the company changes.
- If researchers are using the ratios for analyzing trends, during the period inflationary rate has changed then accuracy of the analysis gets affected.
- The data from the financial statement which researchers are using for the study may have been aggregated in different proportion in the past and therefore doing a trend analysis based on that data doesn’t show a true picture.
- Due to the difference in accounting period, evaluation of the companies becomes challenging.
- A business can do drastic changes in its operations due to certain unexpected needs and thus using the data of the past and making a judgment based on that may not always give a fruitful conclusion.
- Ratio analysis may ignore the qualitative view of the firm.
- The study was only limited to information technology IT sector and also to specific companies.
- In this study the researchers has taken specific five companies so the findings and suggestions are limited to only these companies.
- The researchers have taken only those companies which are having their offices in Pune also.
- The researchers may have made a mistake in any of the ratio calculation in spite of double checking.
Websites
https://www.coursehero.com/file/55911770/2-issn-IJSRMS-0976pdf/
https://www.scribd.com/document/410290135/AStudyOnFinancialPerformanceUsingRatioAnalysisofVisaSteelLimitedfinal-docx
https://www.google.com/url?sa=t&source=web&rct=j&url=http://www.mcser.org/journal/index.php/%2520jesr/article/download/4399/4302&
ved=2ahUKEwju6ZKD5LrpAhVDJHIKHcuGBrwQFjAPegQIBxAB&usg=AOvVaw07oKd3xvCaKL-RRXUzBKta&cshid=1589714712372
https://www.google.com/url?sa=t&source=web&rct=j&url=https://www.iiste.org/Journals/index.php/RJFA/article/download/16837/17175&
ved=2ahUKEwju6ZKD5LrpAhVDJHIKHcuGBrwQFjAQegQIBhAB&usg=AOvVaw1yBkcgKu6TS0sqEsdZx2gg&cshid=1589714712372
https://www.google.com/url?sa=t&source=web&rct=j&url=http://www.shreeprakashan.com/Documents/20160228081655481.7.Dr%2520Mahendra%2520Maisuria.pdf&ved=
2ahUKEwjakf7y_7npAhXVdCsKHVhWA7oQFjABegQIAhAB&usg=AOvVaw2tBVEDg6lZaat1ndJFKm33
https://www.google.com/url?sa=t&source=web&rct=j&url=http://www.academicjournal.in/download/1581/3-1-499-744.pdf&ved=2ahUKEwif0Lqb-LnpAhX0heYKHfYqB_cQFjAMegQIBhAB&usg=AOvVaw31ZKKmS-fARgNsCyT4RlpD
https://www.google.com/url?sa=t&source=web&rct=j&url=https://www.worldwidejournals.com/global-journal-for-research-analysis-
GJRA/recent_issues_pdf/2017/April/April_2017_1493647310__86.pdf&ved=2ahUKEwjZlPWLnpAhWDfH0KHflWDiwQFjAEegQIBRAB&usg=AOvVaw2nTKiHlRrcgREZXOQT8RK5